Markets
AUDUSD
The Aussie is currently sitting on the lower side of pricing since around July 2020, around the 0.708 mark. We are below the 200MA on a weekly chart, and daily chart. On a weekly chart we can see rejections off the support around 0.699, touching 4 times in the past few months. Last week it was reached and we may be bouncing off that level higher for a few weeks.
The anticipation of rate hikes in USA may lead to downward pressure on the AUD, however we may have some time before we see declines just yet.
EURUSD (GER40 fx)
The EUR made solid ground last week after 2 down weeks, currently around the 1.145 mark. The last 2 weeks saw the lowest lows since mid-2020. We are just below the 200MA on a weekly chart, with possibility of not pushing too far through 1.15 over the next week. We are still below the 200MA on a daily chart.
GBPUSD (UK100 fx)
The GBP is in a mid-range position, not high or low at this point in time. We saw a bounce from the lows in November/December off the weekly 200MA and close to the lower bollinger band (2.6 deviation). A possible target in the coming weeks might be 1.368 as we rise towards the daily 200MA off the daily lower Bollinger band in January.
Iron Ore https://markets.businessinsider.com/commodities/iron-ore-price
Iron ore has made a recovery over the past couple of months, now at 145.45 from the lows of 91.98. There is a long way to go to get to 219.77 (52 week High). Iron ore is the primary source of iron for the worlds iron and steel industries. As there is a container shortage, we may see a rise in iron as companies stock up and order container ships which are made of steel.
Gold
The price of gold is 1810, bouncing from lower prices in the past week or two. Sitting above the 200MA on a daily, and well above on a weekly. The weekly chart seems to be forming a triangle and some consolidation, however with uncertainty and stock market losses often comes increase in gold price. Expecting a moderate rise in gold this week.
Silver
Sitting in a similar format to gold with less inflation. Sitting somewhat towards the low Bollinger band (2.6 deviation) on the weekly chart. Expecting a similar movement to gold this week in an upward direction.
UKOil
UK oil is sitting at 93.8 at the time of readin it, very close to poking outside the upper Bollinger band (2.6). We may have a little more gas in the engine however I would image late this week or early next week we will see some relief on oil prices based on the charts only.
USOil
US Oil is sitting in a similar position to UKOil and anticipating some relief on prices in the coming week or two.
Significant Dates
This week’s dates are 7th to the 11th, no options expiry, end of month or start of month.
News and Events
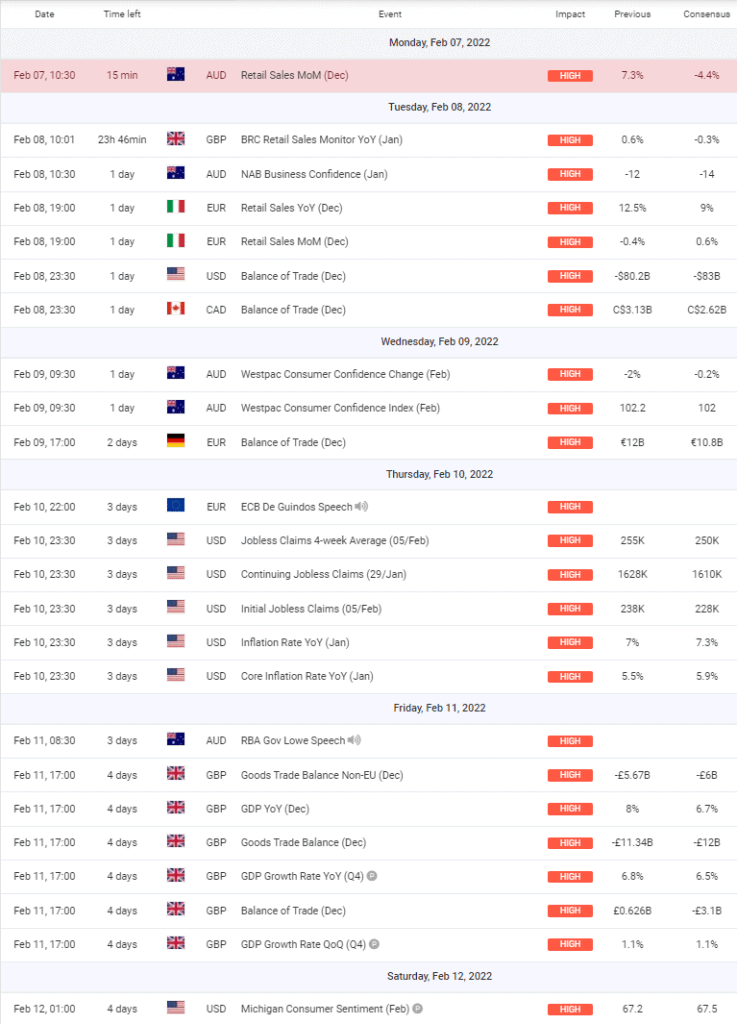
Some high impact announcements for the week (screenshot from MyFXBook.


0 Comments